Quantcast
Channel: Hedgehogs.net: Hedgehogs Blogroll's news channel - Financial Industry News and Blogs
Viewing all 59 articles
Browse latest View live

You'll learn more from your losing trades than your winners

$
0
0
After a series of poor trades, I recently went back and read this Dan Zanger quote:

"You'll learn more from your losers than your winners will ever provide."

Now I believe in studying success and I also think you can learn a lot from your best trades and life decisions. In fact, I sometimes think that people put too much emphasis on the value of learning from one's mistakes instead of studying what went right (and the reasons why). 

Having said that, I'm a big believer in journaling your trades and taking the time to honestly examine your results. That includes our missteps, the less than optimal trades, and those flat out wrong or near-disastrous moves that take big chunks of money out of our accounts.

So if you've hit a rough patch in your trading or your investing returns aren't all they could be, maybe it's time to take a good, hard look at your records and figure out what you can learn from your losing trades. You may just improve your long-term results.


Leading Economic Indicators Suggest Growth Continued Into 2015

History of Low Volatility Investing

$
0
0
I saw this story in Bloomberg magazine a couple weeks ago, so I decided to speak with Ric Bratton again on the history of the low volatility effect. I wanted to speak more about other people's work, especially Ed Miller and Bob Haugen, but somehow we missed that (it's one take and he leads).  In any case, here it is.


 The risk premium is central to Asset Pricing Theory, one of the main things people learn in business school.  If it’s not true, this generates a very different way to assess investments. Below is an outline of what I consider to be the history of low volatility with links to relevant articles. I should have a new paper out in a few days related to my 'solution' to the low volatility effect.

Economics has been hijacked by cargo cult thinking that superficial similarities with physics is the way to create good new theories (eg, see Samuelson's Foundations). As rigor and logic are both more correlated with successful physics and easier to teach, these are the main emphasis at top graduate schools. Alas, rigor is always parochial, because outside a set of small assumptions the rigor doesn't work, which is why no proof in econ has changed anyone's mind about an important issue.  Thus, in finance we had decades of focus on technical econometric issues (e.g., simultaneity of estimating the slope and the intercept, randomness in the risk-free rate, GMM tests of overidentifying restrictions), but not size (market cap) or low-price which would have killed the CAPM in utero. The omitted variables bias and overfitting remain the main scourge of social science empirical research, but that is only taught incidentally.

Back in my day you couldn't publish a paper showing high volatility had lower returns than low volatility because there was no theory for it, so it must be wrong in some technical way, and thus uninteresting. One reviewer told me that if I was to show low volatility had higher returns than high volatility I had to show how low volatility had more risk, which was what I was arguing wasn't true,  That is, the main paradigm has to hold.

A led to strange threads within the low volatility history such as Harvey and Siddique's 2000 paper on sknewness and returns. To the degree skewness relates to returns, it's incidental to the low volatility anomaly. Yet back then you could not address it directly because it was too anomalous to standard theory--utility functions imply some kind of risk premium in an iff sense, they both imply the other.  So, they document that 'co-skewness' (which is positively correlated to volatility), is an extra preference by investors. This allows them to nest their finding within the standard paradigm, because understandibly people like the right tail of a distribution, not the left.

Yet, while they set up the model with the utmost rigor, they never paused to see if their results were  consistent with global risk aversion. It's not.  More practically, the counteracting effect in the Fama-French 3-factor world isn't skew, it's more basic, just volatility; no one makes 'low skewness' portfolios, though common low vol portfolios are correlated with that.

Harvey was for a time the editor of finance's best known journal, The Journal of Finance, and so represents the conventional wisdom of the best academics. Yet this paper is obtuse, they kind of result that gives the word 'academic' the implication 'clueless.'

Another great example is Ang, Hodrick, Xing and Zhang's now seminal 2006 paper documenting the volatility effect for the first time in a top journal. Bob Hodrick is a very prestigious academic, and was on the faculty at Northwest when I was there in the early 1990s, and I showed him my results that low volatility portfolios generated huge 'alpha's in the context of Fama-French 3-factor models, and he couldn't have been more indifferent.  Yet, 12 years later he basically scooped me within the academic literature (my dissertation findings never made a journal).

The trick was that he presented these findings as an addendum to a paper that primarily addressed the extension the returns are a function of changes in volatility. Now, at 30k feet this is a within-the-box extension of the standard model, but note they found it had the wrong sign, that is, stocks correlated with changes in volatility were volatile, and these had lower-than-average returns. Think how bizarre the scientific method is when you are incented to present a new finding as within the paradigm, and  cleverly elide the 'wrong sign' issue by casually noting the 'price of risk' is negative. What does that mean in this context where this clearly isn't some kind of insurance? When Ang et al got to the part of the paper that was actually interesting, the low volatility effect, they then dropped any pretext of a model (as was laid out for their new volatility innovation factor) and showed the tabular results of alpha by volatility, which was the big addition to the literature. At the time (circa 2006) this was the kind of pretext still needed to introduce this result.

That's why the CAPM has dominated academic thinking for decades in spite of it never actually working.

After Freakonomics (2005) and Kahneman's Nobel prize (2002) became famous partial equilibrium empirical findings were publishable in top papers without much motivation, so we see less silliness anymore (alas, the pendulum has perhaps gone too far the other way).  Of course, if you are famous, you could have always gotten a break from an editor, which is why the seminal refutation of the CAPM came from Fama and French, as only they had the credibility to publish a paper seemingly refuting the paradigm (plus, they softened the blow by merely extending it). This phenomenon highlights a strange behavioral bias to the wisdom of smart crowds whatever their pedigree; arguments are strongly constrained by authority and consensus in fields where you can’t do definitive experiments.

Every successful theory has both a principled and unprincipled support; most people who spout correct theories do so for incorrect or selfish reasons. For example, listen to a radio call-in show on some topic you agree with, and note most callers have dumb reasons to agree with you; most people are wrong even when they are right.  The ‘risk begets return’ theory was very convenient for hucksters because they could argue that their vague ‘risk management’ skills generated excess returns, which is tenable because presumably risk is omnipresent and subtle, like the quality of a fine wine.  The theory was also very convenient to economists because it is perfect for teaching a course, where a set of seemingly innocuous assumptions creates a clear set of implications and is amenable to many rigorous extensions. At bottom, the CAPM made logical sense, so it had a principled rationale as well.

Researcher have always thought has occurred that if we can only define our terms, find the basic unit for an indicator, we can create a new science.  The idea that investing would become an exercise in mathematical optimization is very attractive.

As Kant argued, there are two types of knowledge, assumptions vs. theorems, a priori vs. a posteriori.  Assumptions are contingent, empirical, we infer them from data, and inference is imperfect, whereas theorems are logical and can be proven.  Laymen feel that facts are easy and theory is difficult, but this is misleading. Surely smart educated people are better at theory, and so like to spend more time there, but conventional social science facts have always contained major errors.

The most exciting phrase to hear in science - the one that heralds new discoveries - is not "Eureka!" but "That's funny...", which is how the low volatility anomaly was born.  Unlike size or value, it isn't an anomaly so much as death blow to the standard paradigm. You can’t rationalize volatility as a risk factor because its return has the wrong sign with everything intuitively risky (covariance, leverage, size, liquidity, distress). Further, you can't simply add frictions to conventional model to get this as an equilibrium result, unless you invoke massive irrationality, and this isn't tenable because most investors are not irrational in the same way, there’s too much incentive (e.g., money) for that to work.

The arc of how a pillar of science, the CAPM, was created and fell (or, is falling)...
  1. Profits and thus stock returns were a mystery up to 1950
    1. Persistence shouldn’t happen in competitive equilibrium
      1. See Marx, Marshall
    2. Knight (uncertainty, 1921) 
    3. Schumpeter (innovation 1942)
  2. Risk begets return theory developed 1947-62 (CAPM)
    1. Risk premium on investments comes from an if and only if relation to standard economic assumptions, one implies the other and vice versa
    2. Followed creation of macroeconomics in the 1930’s, which basically tried to apply microeconomics to an aggregate  (macro also unsuccessful)
    3. See von Neuman and Morgenstern (1947), Friedman and Schwartz (1948), Markowitz (1952), Tobin (1958), Sharpe (1962)
    4. Empirically confirmed via the 'equity premium' estimate of 9.0% by Lorie and Ficher (1964).
  3. CAPM assumed true 1962-1992
    1. Initial tests of the ‘Capital Asset Pricing Model’ (CAPM) were not supportive of the idea ‘beta’ measures of risk, 
      1. Sharpe, Jensen, Treynor and Mazuy
      2. but still made cover of Institutional Investor Magazine in 1971
    2. Douglas (1969) found little support
      1. Miller-Scholes (1972) added a bunch of corrections, but not size
    3. Statistical tests ‘confirmed’ CAPM in 1973
      1. Fama-MacBeth,  or Black, Jensen and Scholes
      2. Nothing is so convincing as an anticipated discovery
      3. Same papers used as proof through 1990s
  4. CAPM shown incomplete 1992+
    1. Size explains ‘beta’, beta explains nothing within equities
      1. Fama and French 1992, important Fama wrote paper
      2. New 3-factor F-F model, where 'anomalies' are now 'risk factors'
    2. Funds based on size and value blossom
    3. Turned asset pricing theory into a framework, not a theory
  5. Low vol anomaly 2006+
    1. Ang, Hodrick, Xing and Zhang (2006) first big pure academic paper
      1. Finding incidental to paper looking at factor based on a covariance with volatility innovations, and found a slight correlation.  
      2. Bigger finding was that returns were lowest for the highest volatility quintile.
    2. Ang, Hodrick, Xing and Zhang (2009)
      1. Updated volatility to international
      2. Alpha falls off a cliff for high vol stocks 
    3. Funds and papers start in 2006
      1. Clarke, de Silva, and Thorley (2006) at Analytic Investors
      2. Blitz and van Vliet (2007) at Robeco 
      3. Asness, Frazzini, and Pederson (2010, 2013) at AQR
      4. Baker, Bradley and Wurgler (2011) at Acadian.
      5. Analytic Investors, Robeco, Acadian all created a low vol funds around 2006, subsequently outperformed benchmarks with 1/3 less volatility.
    4. Lots of data show this pattern generalizes
      1. For equities: Beta, distress, leverage, penny stocks, options, IPOs, analyst disagreement, mutual funds, over time within a country, across countries
      2. Private equity, C-corps, currencies, corporate bonds, yield curve, futures, movies, sports books, lotteries, real estate, hedge funds, CTAs, merger arb, senior vs. sub distressed debt, peak-peril vs. rebalanced reinsurance portfolios, low vs. high moneyness converts
      3. See my books Finding Alpha (2009), The Missing Risk Premium (2013)
  6. How did we miss this from 1960’s to 2006?
    1. Given standard assumptions, should be true
      1. Consistent with basic economic assumptions about utility functions increasing at a decreasing rate
      2. Intuitive and logical
    2. Creates mathematically beautiful models of endless application 
      1. Keys to a convincing theory: simple enough to be apprehended without much strain but convoluted enough to require a caste of interpreters.  
    3. Focused on statistical techniques 
    4. Explanations today would not work prior to 
      1. Behavioral Economics – Kahneman Nobel Prize (2002)
      2. Freakonomics (2005)
    5. Eventually the truth gets out
  7. With hindsight, lots of early papers saw this
    1. Richard McEnally (1974) found high risk stock to have lower returns, and suggested the following reasons that are now considered highly relevant: 
      1. Seek access to high beta because of leverage constraints
      2. higher taxes on capital gains
      3. delusional investors
      4. skew preferences
    2. Bob Haugen
      1. Haugen and Heins 1975, Haugen and Baker MVP 1991, Haugen and Baker Common Factors (1996) 
      2. In 2008, Haugen found out the low vol funds were all referencing his work, and then claimed to be the ‘father of low vol’ investing. He didn’t emphasize this in real time, however, rather he emphasized a multifactor alternative.
    3. Ed Miller 
      1. 1977 paper modeled how high vol implies a lower return
      2. 2001, Miller mentions this strategy in the Journal of Portfolio Management.  "An implication of [my winner's curse] theory] is that investors can improve their return relative to risk by exploiting the flatness of the security market line."
    4. My experience
      1. First Paragraph of my 1994 dissertation: "This paper documents two new facts. "First, over the past 30 years variance has been negatively correlated with expected return for NYSE and AMEX stocks and this relationship is not accounted for by several well-known prespecified factors (e.g., the price-to-book ratio or size). More volatile stocks have lower returns, other things equal. In fact, one of the prespecified factors, size, obscures this inverse relationship. Second, I document that open-end mutual funds have strong preferences for stocks that are liquid, well-known, and most interestingly, highly volatile stocks."
      2. All the right people thought it was wrong, 'like saying the world was flat' (true quote from one reviewer). Portion of dissertation made Journal of Finance, so it wasn't that I just couldn't write.
      3. Created C-corp fund in 1996, tried to get a backer, no success until I eventually started plying it within hedge funds circa 2003.
    1. Why Important
      1. Clearly the utility function used by economists is simply wrong
        1. Big implications for how we model human behavior
      2. Science as a collective has biases just like individuals
        1. Smart, educated experts see things that aren’t there for decades
        2. Concentrated selectively on rigor
        3. Econometric issues (eg, Shanken, 1985, Gibbons 1982), not omitted variables
    2. My Solution to Why the Low Vol 
      1. Everything is a vice at extremes: an excess or deficit. Risk too can be too little or too much
        1.  Risk is not merely a preference as taught by modern finance.
        2. Optimal risk is varies objectively across individuals based on intelligence, connections 
      2. Low Vol Anomaly needs relative and standard preferences
        1. Highlights we are always thinking about ourselves egotistically and socially
        2. Our desires are both absolute, and relative
        3. These objectives can conflict when fads arise

    Requisite Assumptions for the Persistence of the Low Volatility Anomaly

    $
    0
    0
    My new paper was motivated by Frazzini and Pedersen's model of the low volatility anomaly. Though I think they are profoundly wrong, I think the paper was done well in good faith. Wrong mainly because it still implies people think there's a positive Security Market Line, even though at best it's flat, and wrong also because high vol assets like puts lose just as much money as calls (ie, the alpha is not linear in beta so much as correlated with volatility).  As to it being well done in spite of that, note that unlike Buffa, Vayanos and Woolley (2014), it's not so convoluted it could basically never be estimated, rather it has a concise and simple implication. Working through F&P's result, I think they actually made a math error; not something like a wrong sign, but rather, assumed an invertible matrix in one place, which is then applied to a world where such a matrix is non-invertible. If that doesn't make sense but sounds interesting, take a look at my paper, where I think I have the simplest relative utility model out there (eg, compared to DeMarzo et al, 2005, or Roussanov, 2010). I could have a big mistake in there, so comments welcome.

    Alas, I needed three assumptions to get the low volatility result to hold while still matching some other big datapoints. That is, I don't want a result that implies the equity risk premium is zero, or that rational investors are all shorting high vol stocks, because that's clearly counterfactual, and I also want to explain why high beta/vol assets have a negative alpha in equilibrium. Those assumptions are
    1. some delusionally optimistic investors
    2. systematic risk across beta (eg, high beta stocks can't be hedged with Spiders to create arbitrage)
    3. relative utility (though, not completely, otherwise the equity risk premium is zero)
    I put in some data related to items 1 and 2, because I didn't see a lot of references for these points even though they are pretty plausible and I don't think too controversial. Item 3 is quite controversial, so I motivate that a little by pointing to a lot of other data, especially non-economic data.

    It's here, Requisite Assumptions for the Persistence of the Low Volatility Anomaly.

    The Young Family at the Festival of Trees

    Oh, What A Tangled Web We Weave....

    Merry Christmas!

    Crash at ASPS and OCN: early warning signs

    $
    0
    0
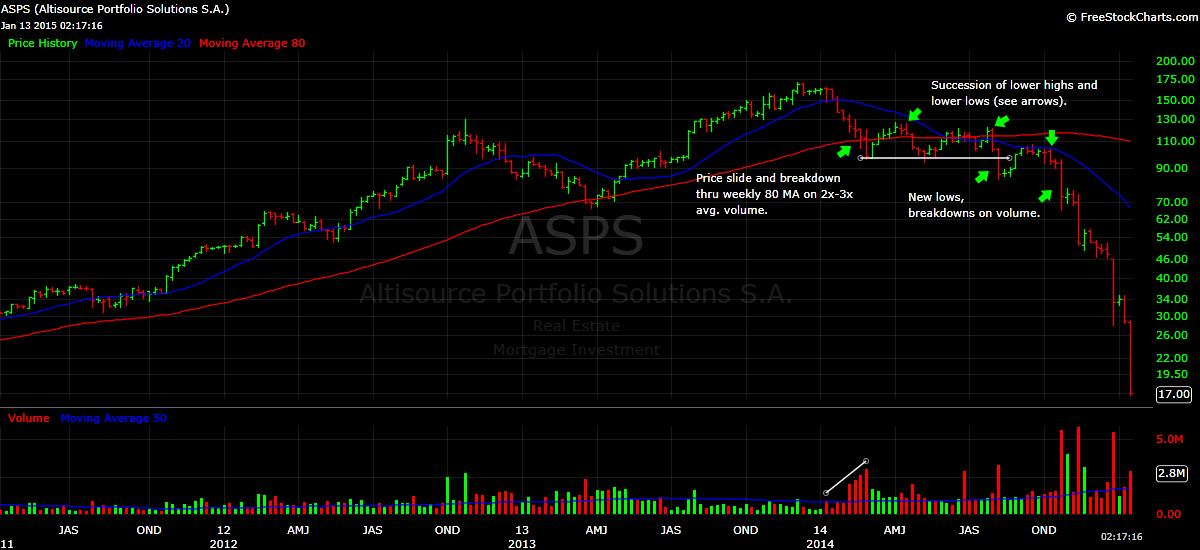
    Altisource (ASPS) and Ocwen Financial (OCN) are on the rocks. 

    What were the early warning signs? We'll examine the stock charts of these two mortgage finance companies to see what went wrong. First, let's provide a little background on the firms and the lead-up to this recent mess.

    Here's a quick summary from Housing Wire on the how and why of this interrelated financial unraveling:

    "To say that Ocwen Financial (OCN) took a beating on Wall Street Tuesday would be the understatement of the century...Ocwen's stock closed Tuesday at $7.78, a loss of more than 36% for the day. One year ago today, Ocwen’s stock was trading at $55.20.

    ...Ocwen was under fire for most of last year, especially from the New York Department of Financial Services, which reached a settlement with Ocwen last month for failures in its mortgage servicing practices.
    As part of the settlement, the NYDFS forced Erbey to resign from his position as chairman of the board of directors of Ocwen, and each of its four related companies: Altisource Portfolio Solutions S.A. (ASPS), Altisource Residential Corporation (RESI), Altisource Asset Management Corporation (AAMC), and Home Loan Servicing Solutions, Ltd. (HLSS), over allegations into Ocwen’s servicing practices and its relationships with its affiliated companies."

    Just over a year ago, Bill Erbey's mortgage finance empire was the subject of flattering profiles in the financial press. Today OCN and ASPS both closed down over 36% and RESI is one of the few REITs starting the year off in negative territory. What a difference a year makes. 

    Here are the weekly charts of ASPS and OCN, shared earlier today on Twitter. I'll include some expanded charts below.


    While the deteriorating price action on the weekly charts may now seem obvious in hindsight, let's take note of some major clues (click charts to expand).


    ASPS stock price chart

    OCN stock price chart

    If you'll review the chart annotations, you'll see that ASPS and OCN both suffered a sharp multi-week sell-off on above average volume in early 2014. These sharp down moves resulted in breaks of ASPS and OCN's newly-formed 200 day moving averages, which could be seen in real-time on their daily charts. Later, a break below the weekly MAs would be evident in the weekly charts above.

    Neither stock could successfully reclaim its previous highs and both continued to trade at new lows. OCN and ASPS continued to trade below their weekly moving averages for the remainder of 2014. You can clearly the see the pattern of lower highs and lower lows that took over. Each successive plunge to new lows came on high volume, a bearish sign indeed. Investors and institutions were saying, "get me out!".

    Another late clue: as stronger stocks bottomed in October 2014 and went on to make new highs, ASPS and OCN both continued lower. Even at that late date, ASPS was trading near $50, while OCN traded above $21 through November.

    A related stock, AAMC, popped up on my radar via manual daily stock scans in the summer and fall of 2014. While the price action looked bearish, I quickly scratched it as a short candidate; AAMC was a $600 stock that traded an average of just 20,000 shares a day.


    AAMC stock price chart

    To protect yourself from steep losses in stocks like ASPS and OCN (or any stock), remember: every big drop starts as distribution and a small decline. Watch for signs of topping or distribution and a change of trend. It's up to us to as traders and investors to manage our risk and decide beforehand where we will cut our losses.

    Disclosure: I have no long or short positions in any of the stocks mentioned at this time.

    WHY USE AN ACTIVE MANAGER?

    Tech stocks chart roundup: GOOG, AMZN, PCLN, AAPL, BABA, GPRO

    $
    0
    0
    Earlier today I tweeted about Alibaba (BABA) and the stock's plunge after its 3Q earnings update.

    Since we'll also see earnings from Google (GOOG) and Amazon (AMZN) after the close today, it's a good time to review some leading tech stock charts and follow up on some of my past posts and recent tweets.

    1) BABA. As I mentioned this morning, BABA's plunge came after weeks of decline. Despite a few rallies, BABA has been making lower highs and lower lows since peaking at $120 in November. Today's move down was the second consecutive day lower on above avg. volume, and the stock sank through the psychologically important $100 level. 

    While there may be an upcoming relief rally, I am avoiding BABA as a long trade until the stock can find support and put in a strong base to move higher. For now, the stock remains in a downtrend. 

    BABA stock price chart Alibaba


    2) AMZN. Amazon, America's great e-commerce giant (and provider of hosting, e-payments, etc.). Last time we checked in with AMZN, the stock was sailing towards new highs above the $350 level. It then peaked above $400 in early 2014 and has edged lower for the past year.

    AMZN will report earnings after the close. Bulls will be hoping for a strong quarter to help turn around its recent EPS losing streak. Prior lows near $283 may provide some support, but the stock is still trending lower and could easily violate these levels. A move above this recent downtrend line and back above the $340 level might signal a change in trend.


    3) GOOG. Google will also report earnings after the close. Like AMZN, it peaked out in early 2014 and has drifted lower since. 

    While betting against Google has never been a good long-term strategy, the intermediate trend remains weak. GOOG is currently trading below its 50 and 200 day moving averages (see daily chart).


    Google stock price chart


    4) PCLN. Priceline will report earnings next month. Just wanted to point out another high-dollar tech leader that's drifted lower off its early 2014 highs. See a pattern here with this group?

    Potential support area in the $780 - $800 level if the stock continues lower.


    5) AAPL. Apple is the one consumer tech leader that is showing strength here. After a blowout quarter and the usual gushing over the piles of cash Apple makes, it's clear the notion that "Apple's best days are behind them (post-Jobs)" are being put to rest.

    I will consider AAPL as a long trade in the coming days. Probably should have acted on the bullish turnaround view earlier (May 2014 tweet).


    6). GPRO. GoPro is down considerably from its October 2014 highs near $98. 

    Hopes for a big Christmas rally in GPRO shares did not materialize, and the stock is trading below its 20 and 50 day moving averages. While the pattern of lower highs and lower lows persists, I will not go long GPRO. Note: GPRO reports earnings next week.


    To sum up, most of the current action I'm seeing in these tech leaders is bearish. The exception being AAPL, trading near an all-time high. With earnings season upon us, it's best to be highly selective and manage your risk.

    Jim Leitner quote: Follow up on your investment ideas

    $
    0
    0
    Global macro investor, Jim Leitner of Falcon Management was interviewed for Steven Drobny's book, Inside the House of Money. I've included one of my favorite quotes, on the importance of following up on investing ideas, below.

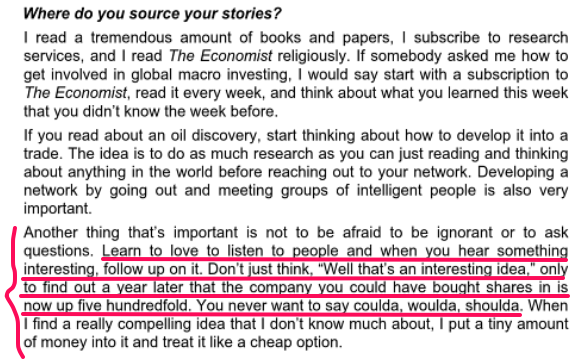
    "Learn to love to listen to people and when you hear something interesting, follow up on it. Don't just think, "Well that's an interesting idea" only to find out a year later that the company you could've bought shares in is now up 500-fold. You never want to say woulda, coulda, shoulda." 

    Jim Leitner Falcon hedge fund manager quote investing

    This is an especially relevant quote, as I've struggled with regrets over missed opportunities after I failed to pull the trigger on some of my best investing ideas (click through for more on this trading phenomenon). 

    During the course of this bull market, I've also made errors of omission when it came to following up on unique investing and trading ideas gleaned from other smart traders. Maybe you've faced the same issues in your trading and investing journey. So what steps can we take to change and seize the opportunities that we uncover?

    The important thing to take away from Leitner's quote is the importance of following up on ideas, even if it's just by taking a small starter position ("a tiny amount of money"). 

    If you reduce the size of your initial commitment (say, 20 shares vs. your usual 200 or 1000 shares) it will allow you to have a small "feeler" position that can be increased as the investment works out or goes your way. That way, you can step up your position size as you begin to see a profit. Conversely, you will limit your initial losses to a small portion of your overall capital if the trade should go against you.

    Uncle, Uncle!!

    How to "Pull the Trigger" on Your Trading Ideas

    $
    0
    0
    In our last post, I quoted hedge fund manager, Jim Leitner on the importance of following up on your investment ideas. 

    Today I'd like to follow up and share some thoughts on how you can learn to consistently "pull the trigger" on your best trading setups and investing ideas.

    In order to help you do that, we'll take from the best and offer up key insights from interviews with top traders and trading psychologists like Alan Farley, Brett Steenbarger, and Doug Hirschhorn

    Now before we get to their key insights on overcoming trading anxiety and pulling the trigger on your trading ideas, let's remember what Jim Leitner said in his interview:

    "Learn to love to listen to people and when you hear something interesting, follow up on it. Don't just think, "Well that's an interesting idea" only to find out a year later that the company you could've bought shares in is now up 500-fold. You never want to say woulda, coulda, shoulda.".

    The method Leitner stressed to aid us in following up on our investment ideas was taking a small initial position. As I wrote in that post, a small "feeler" position can help us get a toe in the water while keeping our capital risk defined. As the trade goes your way and you begin to see a profit, you can always add to the position (or cut back) in a responsible way. 

    Poster via Keep Calm-O-Matic.

    What if you're not sure how to enter a trade ("do I buy a breakout to new highs or buy on a pullback?"). Or what if you're not exactly able to clearly articulate your reasons for taking a trade? Or maybe you just don't know if this particular trade will work out in your favor.

    Alan Farley addresses these questions in his "Pulling the Trigger Q+A": 

    "You're really asking the ultimate Zen trading question: How do I know I'm right? 

    Zen answer: There is no right and no wrong. You manage risk. Do that well, and you're right.

    Breakouts and breakdowns either go or they don't go. Most of the time you can't tell the difference. Some patterns are easier than others to interpret, and certain kinds of setups have a gut feel that tells you the coast is clear. Just control risk the rest of the time and take the trade to its logical conclusion.

    Remember the input you have on the position's outcome. First, you can choose a small position instead of a large one. This keeps your risk small if you're wrong, but you can still make money if you're right. Second, you can take your best shot and keep a tight stop-loss. You take the loss and move on if you're wrong. You add to your position if you're right."

    Olivier Tischendorf has written about the importance of trading meaningful position sizes

    However, there are times (in choppy market conditions, or after a tough losing streak) when you may want to enter trades with a position size that is smaller than usual. This will help you to focus on your overall process and prevent you from assigning too much importance to the outcome of a single trade. 

    As Olivier summarized it in a recent conversation:  

    "Small position sizes allow you to approach the market in a disciplined and non-emotional way. It helps to overcome the paralysis of analysis. 

    If you struggle emotionally with trading, you should trade smaller position sizes. You'll be more process oriented instead of focusing on the outcome of a single trade. This will allow you to "Just Do It" vs. second-guessing yourself on trades."  

    Many times, it seems, the failure to follow up on our investing or trade ideas can be traced back to simple fear. Fear of failure, fear of being wrong, a lack of confidence in our skills, or a poorly vetted trading process may be holding us back in our trading development. 

    Tim Bourquin interviewed 3 top trading coaches, Dr. Brett Steenbarger, Dr. Doug Hirschhorn, and Dr. Gary Dayton, about these fears and the performance anxieties we often face as traders. 

    They offered up some helpful ideas and exercises in, "Overcoming Your Fear of "Pulling the Trigger"":  

    "A lot of traders haven't gone through that kind of developmental process where they first practice their setups then they trade them small, and then they trade them larger.

    They're too eager to get right in there and jump right in and trade. And as a result, they don't have the battle test experience. They don't have the confidence in their setups and it can show up as hesitancy and problems in pulling the trigger." - Brett Steenbarger

    "Trade in smaller sizes. That's how you practice the skill. Get yourself comfortable with actually putting the risk on and putting the trade on. Because once you can do it with small size and the only differential is changing the default on the size." - Doug Hirschhorn

    "What matters to a trader? Well, identifying trades, taking trades, managing sound trades setups and managing them to completion. And if it's only 10 shares, then it's only 10 shares, but that's still taking a step in the direction of what's most important. 

    And then be mindful about it as you're doing it. Note what thoughts and feelings you're having. And just pull back from them and accept them as thoughts and feeling that pass that come and go" - Gary Dayton

    So whether you're an experienced trader or a newbie investor, I hope you'll come back and reference this post whenever you need encouragement to pull the trigger and act on your research and investing ideas. I hope some of this material helps you as much as it has helped me (even as I researched and wrote this entry).

    Thanks for reading and sharing. Keep up with us on Twitter for more trading ideas and real-time updates.  

    Now Showing in Europe: Negative Yields â Next Stop: The U.S.?

    The Dot-Com Bubble in 1 Chart: InfoSpace

    $
    0
    0
    With all the recent talk of a new bubble in the making, thanks in part to the Yellen Fed's continued easy money stance, I thought it'd be instructive to revisit our previous stock market bubble - in one quick chart.

    So here's what a real stock market bubble looks like. 

     
    For those of you who are a little too young to recall it, this is a chart of InfoSpace at the height of the Nasdaq dot-com bubble in 1999-2001. This fallen angel soared to fantastic heights only to plummet back down to earth as the bubble, and InfoSpace's shady business plan, turned to rubble.

    As detailed in our post, "Round trip stocks: Momentum booms and busts", InfoSpace rocketed from under $100 a share to over $1,300 a share in less than six months. 

    In a pattern common to many parabolic shooting stars, the stock soon peaked and began a "stage four" decline back to its pre-bubble base. In fact, it sank to levels far below that base. Today, Infospace, having re-branded itself as Blucora (BCOR), trades at a 99% discount to its dot-com bubble peak.   

    Are there other boom-and-bust candidates that might claim the title of "quintessential Nasdaq bubble stock"? Sure, and if we pool our heads together and think about it for a few moments, I'm sure we can think of a couple. We'll examine some tech survivors, and tech wrecks, in a follow-up post as we hone in on Nasdaq 5,000 for the first time in 15 years. 

    What I Learned Losing a Million Dollars: Interview with Brendan Moynihan

    $
    0
    0
    What I Learned Losing a Million Dollars book coverNext on my to-read list is Jim Paul and Brendan Moynihan's book, What I Learned Losing a Million Dollars. It is the story of one trader's (Jim Paul) disastrous losing streak and how he (barely) survived it, learning a few key lessons on ego and risk in the process.

    As you'll note from the book's rather unusual title, What I Learned Losing a Million Dollars is not your typical "trading system-in-a-book", promising a golden pathway to riches. It deals squarely with losses and how overconfidence and success can lead us to complacency and ruin. So what lessons can we take from another trader's experience losing large sums of money? 

    Tim Ferris recently interviewed the book's co-author, Brendan Moynihan. Here are some highlights from their discussion:

    • While introducing Brendan Moynihan, Tim mentions that he was won over by Nassim Taleb's recommendation of the book, which he praised for its "non-charlatanic" real-life wisdom. Moynihan says that the interest generated from Taleb's endorsement spurred them to reprint the book. 

    • Moynihan met globetrotting investor, Jim Rogers in Alabama. He learned a bit about finance from Rogers and decided he wanted to get involved with the markets. While working in Chicago, Moynihan met futures trader, Jim Paul and heard the story of his near-washout. He later flew to his home in Chicago to record Paul and transcribe his story into a book. Some amusing stories about Paul and self-publishing in the pre-internet age are included.

    • When we lose money, we tend to internalize what should be an external loss. People often equate net worth with self-worth, a fatal mistake.

    • There are (according to Moynihan) 5 types of market participants: investors, speculators, traders, bettors, and gamblers. How you behave in the market environment defines you in terms of each class of participant. "You don't have to be in a casino to gamble. You can gamble in the markets." Bettors, gamblers, and investors all have different motivations, methods, and decision making processes.

    • When emotions become involved in your decision making, you have personalized the issue. Emotions are inherent to our makeup, but emotional decision making in markets can be disastrous. As Gustave Le Bon wrote in The Crowd, a crowd is the single entity that best exhibits the phenomenon of emotional decision making. 

    • There are many ways to make money in the markets. There are a few reliable ways (emotional pitfalls) to lose your money. 

    • Come up with a trading plan and a written checklist that will guide your buy and sell decisions in the market. Tim Ferris cites another book, The Checklist Manifesto, that outlines the profound changes we see in hospitals when performance and safety guidelines are enforced with written procedural checklists. 

    • The best thing you can do as a trader or investor is learn to recognize and cut your losses. Due to our schooling system, we equate being wrong with losing points and esteem (for more on this, see Michael Martin's book, The Inner Voice of Trading.). In the markets, losing or making money is not about being right or wrong. We need to manage risk and stick with our process.

    Check out the full interview with Brendan Moynihan here. 


    You can learn more about the habits of successful traders vs. losing traders in our related links below. Check them out!

    Related posts

    1. Marty Schwartz speaks at Amherst College.

    2. Why traders fail: Mark Minervini interivew

    3. What makes a great trader? Managing risk.

    Video: Paul Tudor Jones and Peter Borish on trading

    Tesla Model X opens its Falcon Wing Doors (GIF)

    Futures winners and losers: VIX jumped, crude oil sank in 2015

    $
    0
    0
    Futures, 1-year performance highlights: 

     
    The VIX volatility index zoomed higher as stocks declined in August and September. Japan's Nikkei 225 topped the Finviz futures list of leading stock indexes. The S&P 500 has managed to eke out a gain of 1% over the past year.

    As noted on Twitter, I believe Finviz' data on ethanol futures is incorrect (they show a 1-year gain of 70%). Here's a continuous weekly chart on ethanol that shows a picture of flat returns over last year's prices.  


    Metals and energy prices suffered over the past year, as copper and platinum fell over 20%. Natural gas sank 41%, but the biggest hits came to WTI and Brent crude oil. 

    Focusing in on oil, this year's worst performer, we see WTI crude oil down 50% for the year.


    Oil is now trading near $45, down well off its highs near $100 - $110 of the last several years. Of course, that's taken the entire oil and gas complex down with it. The crash in oil and energy stocks is a trend we've covered on Twitter and StockTwits since late 2014. More on that to come in a future post.

    Wal-Mart plunges to 3-year low: chart update

    $
    0
    0
    Wal-Mart's ($WMT) stock plunged 10% lower today, its worst one day drop in six years, after the company detailed its increased operating expenses and projected lower earnings (click for slides and EPS projections) for its 2017 fiscal year. 

    Let's check out the price action and the trends. Wal-Mart daily chart (below). WMT is down 10% this afternoon.


    Wal-Mart stock WMT daily chart


    This latest drop on heavy volume brings WMT to a new 3-year low, as the stock hits levels not seen since mid 2012. As you'll note from the monthly chart I shared earlier this week on Twitter, WMT has fallen back into its decade-long trading range, below $70.

     
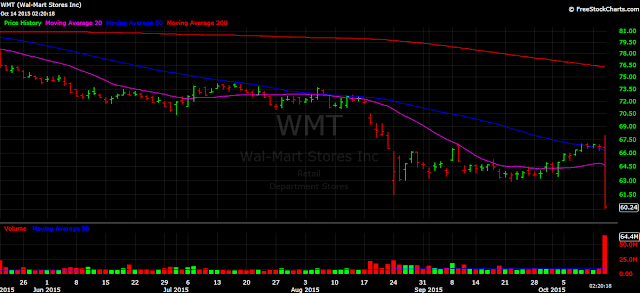
    We first highlighted Wal-Mart's drop and retail weakness back in August. See the chart + tweet below.


    Today's plunge is in line with the downtrend in place since early 2015. After making new highs above $90 in January, Wal-Mart (WMT) failed to hold above the $80+ level. The stock slipped below its 50 and 200 day moving averages in the spring of 2015 and has continued lower.

    "Successful traders always follow the line of least resistance. Follow the trend. The trend is your friend!" - Jesse Livermore (Hat tip: Olivier Tischendorf, Chris Perruna). 

    Of course, Wal-Mart's increased spending costs and flat sales come against the backdrop of its longer-term fight with dominant online rival, Amazon. As we increasingly shift to a world of online shopping, big box retailers like Wal-Mart and Target must invest to compete online with Amazon. 

    AMZN Amazon stock price chart


    Meanwhile AMZN is trading nearer to its all-time high. Amazon's $255 billion market cap now handily exceeds Wal-Mart's $193 billion market cap. While Amazon's stock (AMZN) has increased more than 400% over the course of this bull market, Wal-Mart (WMT) has, as of today, only managed a gain of 20% since 2009. 

    WMT stock chart


    Wal-Mart's huge growth phase (click the WMT chart to see its 30-fold rise during the 1980s and 1990s) has given way to maturation. Currently, up-and-coming, or dominant, online retailers like Amazon are enjoying their moment in the stock market's sun.
    Viewing all 59 articles
    Browse latest View live


    Latest Images